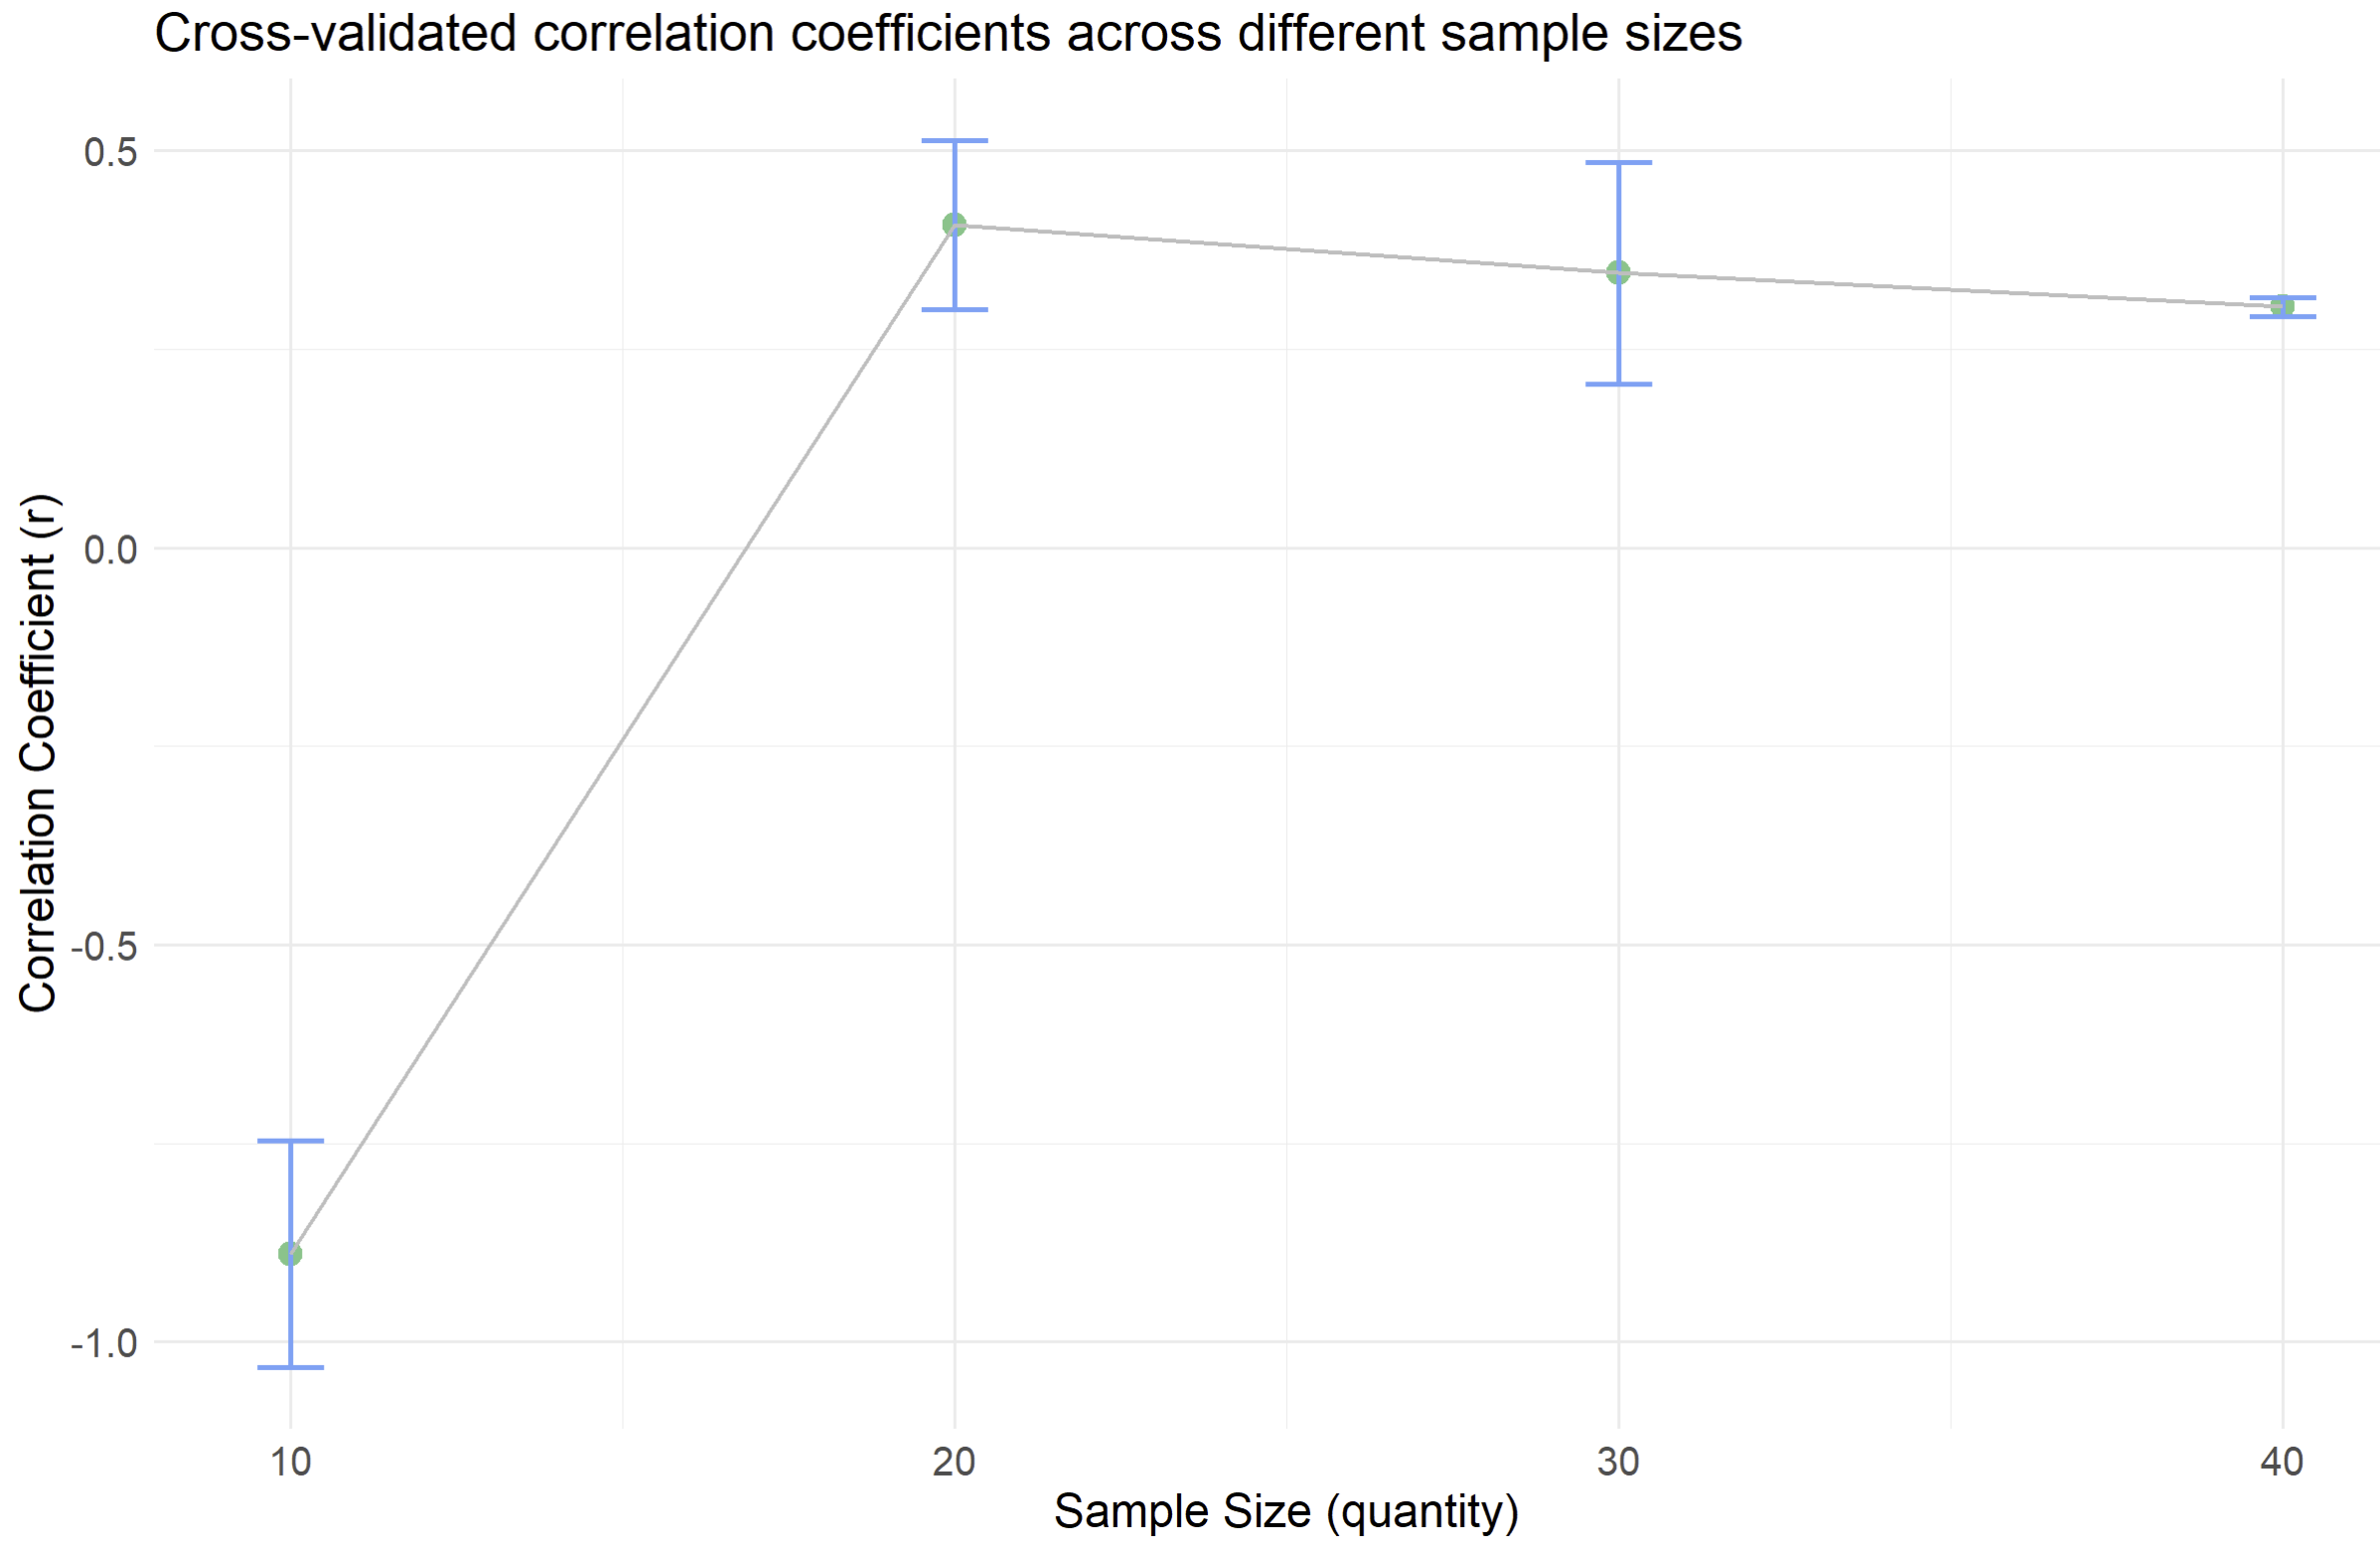
(experimental) Plot cross-validated correlation coefficients across different sample-sizes from the object returned by the textTrainN function. If the number of cross-validations exceed one, then error-bars will be included in the plot.
Source:R/2_5_textTrainN.R
textTrainNPlot.Rd(experimental) Plot cross-validated correlation coefficients across different sample-sizes from the object returned by the textTrainN function. If the number of cross-validations exceed one, then error-bars will be included in the plot.
textTrainNPlot(
  train_data,
  sample_percents = c(25, 50, 75, 100),
  n_cross_val = rep(1, length(tibble_list)),
  x_unit = "percent",
  y_range = NULL,
  title = "Cross-validated correlation coefficients across different sample sizes",
  x_axes_label = "Sample Size (percent)",
  y_axes_label = "Correlation Coefficient (r)",
  point_color = rep("#5dc688", length(tibble_list)),
  bar_color = rep("#60A1F7", length(tibble_list)),
  line_color = rep("grey", length(tibble_list)),
  bar_width = rep(1, length(tibble_list)),
  bar_size = rep(0.8, length(tibble_list)),
  line_size = rep(0.6, length(tibble_list)),
  line_type = rep("straight", length(tibble_list)),
  point_size = rep(3, length(tibble_list)),
  log_transform_x = FALSE
)
Arguments
- train_data
(list) One or several objects returned by the function textTrainN as a list (e.g, list(object1, object2)). Also, If several models are provided, then one can add a vector c() with settings (i.e the parameters below) for each model (make sure to add the settings in the order as the models are ordered, if you look to keep the original settings then write "").
- sample_percents
(numeric) Vector containing the percents of the total number of datapoints that is included in each sample (default = c(25,50,75,100)).
- n_cross_val
(numeric) Value of the number of times cross-validation has been repeated (default = 1, i.e., cross-validation has only been applied once). If several models are provided, then one can add a vector c() with settings for each model (make sure to add the settings in the order as the models are ordered).
- x_unit
(character, "percent" or "quantity") Determines whether the x-axis-values should represent the number of elements in each sample, or the number of percent of the total data they represent (default = "percent").
- y_range
(numeric) Optional. Determines the y_range. E.g, y_range = c(1,2) sets the y_range from 1 to 2 (default = NULL).
- title
(character) Determine plot title (default = "Cross-validated correlation coefficients across different sample sizes").
- x_axes_label
(character) Determine x-axis-label (default = "Sample Size (percent)").
- y_axes_label
(character) Determine y-axis-label (default = "Correlation Coefficient (r)").
- point_color
(character, (Hex color codes)) Determine point color (default = "#5dc688").
- bar_color
(character, (Hex color codes)) Determine error-bar color (default = "#60A1F7").
- line_color
(character, (Hex color codes)) Determine line color (default = "grey").
- bar_width
(numeric) Determine bar-width (default = 1).
- bar_size
(numeric) Determine bar-size (default = 1).
- line_size
(numeric) Determine line-size (default = 1).
- line_type
(character, either "straight" or "smooth") Determine line-type (default = "straight").
- point_size
(numeric) Determine points size (default = 1).
- log_transform_x
(boolean) Determine wether to log-transform x in case of displaying number of samples (default = FALSE).
Value
A plot with correlation coefficient on y-axis and sample size in quantity or percent on x axis. If number och cross-validations exceed 1, then error bars measuring standard deviations will be plotted.
Plot Example
Example of a plot created by textTrainNPlot.
See also
See textTrainN.
Examples
# Plot cross-validated correlation coefficients across different sample-sizes from the object
# returned by the textTrainN function.

if (FALSE) {
# Plot the performance of a single model across different sample sizes
plot_object1 <- textTrainNPlot(
  train_data = tibble_to_plot,
  n_cross_val = 3,
  x_unit = "quantity"
)

# Visualize plot
plot_object1

# Plot the performance of several models across different sample sizes.
plot_object2 <- textTrainNPlot(train_data = list(object1, object2, object3),
                               n_cross_val = c(2,1,1),
                               line_color = c("","","#0000FF")) # "" gives the default settings.
# Visualize plot
plot_object2
}