textPlot() plots words from textProjection() or textWordPrediction().
Usage
textPlot(
  word_data,
  k_n_words_to_test = FALSE,
  min_freq_words_test = 1,
  min_freq_words_plot = 1,
  plot_n_words_square = 3,
  plot_n_words_p = 5,
  plot_n_word_extreme = 5,
  plot_n_word_extreme_xy = 0,
  plot_n_word_frequency = 5,
  plot_n_words_middle = 5,
  plot_n_word_random = 0,
  titles_color = "#61605e",
  y_axes = FALSE,
  p_alpha = 0.05,
  overlapping = TRUE,
  p_adjust_method = "none",
  projection_metric = "dot_product",
  title_top = "Supervised Dimension Projection",
  x_axes_label = "Supervised Dimension Projection (SDP)",
  y_axes_label = "Supervised Dimension Projection (SDP)",
  scale_x_axes_lim = NULL,
  scale_y_axes_lim = NULL,
  word_font = NULL,
  bivariate_color_codes = c("#398CF9", "#60A1F7", "#5dc688", "#e07f6a", "#EAEAEA",
    "#40DD52", "#FF0000", "#EA7467", "#85DB8E"),
  word_size_range = c(3, 8),
  position_jitter_hight = 0,
  position_jitter_width = 0.03,
  point_size = 0.5,
  arrow_transparency = 0.1,
  points_without_words_size = 0.2,
  points_without_words_alpha = 0.2,
  legend_title = "SDP",
  legend_x_axes_label = "x",
  legend_y_axes_label = "y",
  legend_x_position = 0.02,
  legend_y_position = 0.02,
  legend_h_size = 0.2,
  legend_w_size = 0.2,
  legend_title_size = 7,
  legend_number_size = 2,
  legend_number_colour = "white",
  group_embeddings1 = FALSE,
  group_embeddings2 = FALSE,
  projection_embedding = FALSE,
  aggregated_point_size = 0.8,
  aggregated_shape = 8,
  aggregated_color_G1 = "black",
  aggregated_color_G2 = "black",
  projection_color = "blue",
  seed = 1005,
  explore_words = NULL,
  explore_words_color = "#ad42f5",
  explore_words_point = "ALL_1",
  explore_words_aggregation = "mean",
  remove_words = NULL,
  n_contrast_group_color = NULL,
  n_contrast_group_remove = FALSE,
  space = NULL,
  scaling = FALSE,
  ...
)
Arguments
- word_data
Dataframe from textProjection.
- k_n_words_to_test
Select the k most frequent words to significance test (k = sqrt(100*N); N = number of participant responses) (default = TRUE).
- min_freq_words_test
Select words to significance test that have occurred at least min_freq_words_test (default = 1).
- min_freq_words_plot
Select words to plot that has occurred at least min_freq_words_plot times (default = 1).
- plot_n_words_square
Select number of significant words in each square of the figure to plot. The significant words, in each square is selected according to most frequent words (default = 3).
- plot_n_words_p
Number of significant words to plot on each (positive and negative) side of the x-axes and y-axes, (where duplicates are removed); selects first according to lowest p-value and then according to frequency (default = 5). Hence, on a two dimensional plot it is possible that plot_n_words_p = 1 yield 4 words.
- plot_n_word_extreme
Number of words that are extreme on Supervised Dimension Projection per dimension. (i.e., even if not significant; per dimension, where duplicates are removed).
- plot_n_word_extreme_xy
Number of words that are extreme in both x and y dimensions, considering overall distance from the origin in the Supervised Dimension Projection space. This selects words based on their combined extremity score, calculated as the Euclidean distance from (0,0). Ensures balance across all nine squares by selecting at least one extreme word per square if available.
- plot_n_word_frequency
Number of words based on being most frequent (default = 5). (i.e., even if not significant).
- plot_n_words_middle
Number of words plotted that are in the middle in Supervised Dimension Projection score (default = 5). (i.e., even if not significant; per dimensions, where duplicates are removed).
- plot_n_word_random
(numeric) select random words to plot.
- titles_color
Color for all the titles (default: "#61605e").
- y_axes
(boolean) If TRUE, also plotting on the y-axes (default = FALSE, i.e, a 1-dimensional plot is generated). Also plotting on y-axes produces a two dimension 2-dimensional plot, but the textProjection function has to have had a variable on the y-axes.
- p_alpha
Alpha (default = .05).
- overlapping
(boolean) Allow overlapping (TRUE) or disallow (FALSE) (default = TRUE).
- p_adjust_method
(character) Method to adjust/correct p-values for multiple comparisons (default = "none"; see also "holm", "hochberg", "hommel", "bonferroni", "BH", "BY", "fdr").
- projection_metric
(character) Metric to plot according to; "dot_product" or "cohens_d".
- title_top
Title (default " ").
- x_axes_label
(character) Label on the x-axes (default = "Supervised Dimension Projection (SDP)").
- y_axes_label
(character) Label on the y-axes (default = "Supervised Dimension Projection (SDP)").
- scale_x_axes_lim
Manually set the length of the x-axes (default = NULL, which uses ggplot2::scale_x_continuous(limits = scale_x_axes_lim); change e.g., by trying c(-5, 5)).
- scale_y_axes_lim
Manually set the length of the y-axes (default = NULL; which uses ggplot2::scale_y_continuous(limits = scale_y_axes_lim); change e.g., by trying c(-5, 5)).
- word_font
Font type (default = NULL).
- bivariate_color_codes
(HTML color codes. Type = character) The different colors of the words. Note that, at the moment, two squares should not have the exact same colour-code because the numbers within the squares of the legend will then be aggregated (and show the same, incorrect value). (default: c("#398CF9", "#60A1F7", "#5dc688", "#e07f6a", "#EAEAEA", "#40DD52", "#FF0000", "#EA7467", "#85DB8E")).
- word_size_range
Vector with minimum and maximum font size (default: c(3, 8)).
- position_jitter_hight
Jitter height (default: .0).
- position_jitter_width
Jitter width (default: .03).
- point_size
Size of the points indicating the words' position (default: 0.5).
- arrow_transparency
Transparency of the lines between each word and point (default: 0.1).
- points_without_words_size
Size of the points not linked with a words (default is to not show it, i.e., 0).
- points_without_words_alpha
Transparency of the points not linked with a words (default is to not show it, i.e., 0).
- legend_title
Title on the color legend (default: "SDP").
- legend_x_axes_label
Label on the color legend (default: "x").
- legend_y_axes_label
Label on the color legend (default: "y").
- legend_x_position
Position on the x coordinates of the color legend (default: 0.02).
- legend_y_position
Position on the y coordinates of the color legend (default: 0.05).
- legend_h_size
Height of the color legend (default 0.15).
- legend_w_size
Width of the color legend (default 0.15).
- legend_title_size
Font size (default: 7).
- legend_number_size
Font size of the values in the legend (default: 2).
- legend_number_colour
(string) Colour of the numbers in the box legend.
- group_embeddings1
(boolean) Shows a point representing the aggregated word embedding for group 1 (default = FALSE).
- group_embeddings2
(boolean) Shows a point representing the aggregated word embedding for group 2 (default = FALSE).
- projection_embedding
(boolean) Shows a point representing the aggregated direction embedding (default = FALSE).
- aggregated_point_size
Size of the points representing the group_embeddings1, group_embeddings2 and projection_embedding (default = 0.8).
- aggregated_shape
Shape type of the points representing the group_embeddings1, group_embeddings2 and projection_embedding (default = 8).
- aggregated_color_G1
Color (default = "black").
- aggregated_color_G2
Color (default = "black").
- projection_color
Color (default = "blue").
- seed
(numeric) Set different seed (default = 1005)..
- explore_words
Explore where specific words are positioned in the embedding space. For example, c("happy content", "sad down") (default = NULL).
- explore_words_color
Specify the color(s) of the words being explored. For example c("#ad42f5", "green") (default = "#ad42f5").
- explore_words_point
Specify the names of the point for the aggregated word embeddings of all the explored words (default = "ALL_1").
- explore_words_aggregation
Specify how to aggregate the word embeddings of the explored words (default = "mean").
- remove_words
Manually remove words from the plot (which is done just before the words are plotted so that the remove_words are part of previous counts/analyses) (default = NULL).
- n_contrast_group_color
Set color to words that have higher frequency (N) on the other opposite side of its dot product projection (default = NULL).
- n_contrast_group_remove
Remove words that have higher frequency (N) on the other opposite side of its dot product projection (default = FALSE).
- space
Provide a semantic space if using static embeddings and wanting to explore words (default = NULL).
- scaling
Scaling word embeddings before aggregation (default = FALSE).
- ...
Settings for textOwnWordsProjection().
See also
See textProjection.
Examples
# The test-data included in the package is called: DP_projections_HILS_SWLS_100
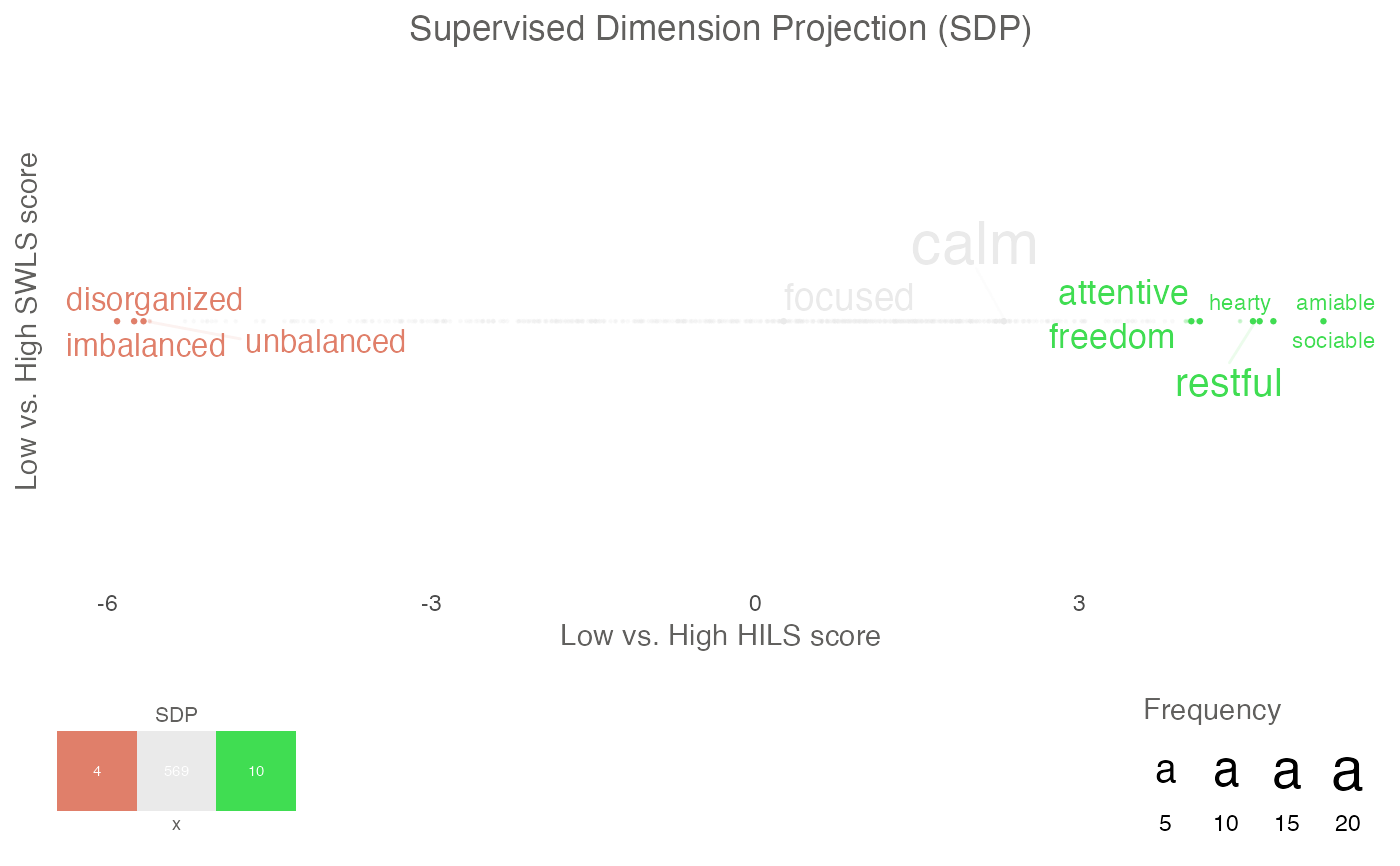
# Supervised Dimension Projection Plot
plot_projection <- textPlot(
word_data = DP_projections_HILS_SWLS_100,
k_n_words_to_test = FALSE,
min_freq_words_test = 1,
plot_n_words_square = 3,
plot_n_words_p = 3,
plot_n_word_extreme = 1,
plot_n_word_frequency = 1,
plot_n_words_middle = 1,
y_axes = FALSE,
p_alpha = 0.05,
title_top = "Supervised Dimension Projection (SDP)",
x_axes_label = "Low vs. High HILS score",
y_axes_label = "Low vs. High SWLS score",
p_adjust_method = "bonferroni",
scale_y_axes_lim = NULL
)
plot_projection
#> $final_plot
 #>
#> $description
#> [1] "INFORMATION ABOUT THE PROJECTION type = textProjection words = $ wordembeddings = Information about the embeddings. textEmbedLayersOutput: model: bert-base-uncased ; layers: 11 12 . Warnings from python: Some weights of the model checkpoint at bert-base-uncased were not used when initializing BertModel: ['cls.seq_relationship.bias', 'cls.seq_relationship.weight', 'cls.predictions.transform.LayerNorm.bias', 'cls.predictions.transform.dense.bias', 'cls.predictions.decoder.weight', 'cls.predictions.bias', 'cls.predictions.transform.LayerNorm.weight', 'cls.predictions.transform.dense.weight']\n- This IS expected if you are initializing BertModel from the checkpoint of a model trained on another task or with another architecture (e.g. initializing a BertForSequenceClassification model from a BertForPreTraining model).\n- This IS NOT expected if you are initializing BertModel from the checkpoint of a model that you expect to be exactly identical (initializing a BertForSequenceClassification model from a BertForSequenceClassification model).\n\n textEmbedLayerAggregation: layers = 11 12 aggregate_layers = concatenate aggregate_tokens = mean tokens_select = tokens_deselect = single_wordembeddings = Information about the embeddings. textEmbedLayersOutput: model: bert-base-uncased layers: 11 12 . textEmbedLayerAggregation: layers = 11 12 aggregate_layers = concatenate aggregate_tokens = mean tokens_select = tokens_deselect = x = $ y = $ pca = aggregation = mean split = quartile word_weight_power = 1 min_freq_words_test = 0 Npermutations = 1e+06 n_per_split = 1e+05 type = textProjection words = Language_based_assessment_data_3_100 wordembeddings = Information about the embeddings. textEmbedLayersOutput: model: bert-base-uncased ; layers: 11 12 . Warnings from python: Some weights of the model checkpoint at bert-base-uncased were not used when initializing BertModel: ['cls.seq_relationship.bias', 'cls.seq_relationship.weight', 'cls.predictions.transform.LayerNorm.bias', 'cls.predictions.transform.dense.bias', 'cls.predictions.decoder.weight', 'cls.predictions.bias', 'cls.predictions.transform.LayerNorm.weight', 'cls.predictions.transform.dense.weight']\n- This IS expected if you are initializing BertModel from the checkpoint of a model trained on another task or with another architecture (e.g. initializing a BertForSequenceClassification model from a BertForPreTraining model).\n- This IS NOT expected if you are initializing BertModel from the checkpoint of a model that you expect to be exactly identical (initializing a BertForSequenceClassification model from a BertForSequenceClassification model).\n\n textEmbedLayerAggregation: layers = 11 12 aggregate_layers = concatenate aggregate_tokens = mean tokens_select = tokens_deselect = single_wordembeddings = Information about the embeddings. textEmbedLayersOutput: model: bert-base-uncased layers: 11 12 . textEmbedLayerAggregation: layers = 11 12 aggregate_layers = concatenate aggregate_tokens = mean tokens_select = tokens_deselect = x = Language_based_assessment_data_3_100 y = Language_based_assessment_data_3_100 pca = aggregation = mean split = quartile word_weight_power = 1 min_freq_words_test = 0 Npermutations = 1e+06 n_per_split = 1e+05 type = textProjection words = harmonywords wordembeddings = Information about the embeddings. textEmbedLayersOutput: model: bert-base-uncased ; layers: 11 12 . Warnings from python: Some weights of the model checkpoint at bert-base-uncased were not used when initializing BertModel: ['cls.seq_relationship.bias', 'cls.seq_relationship.weight', 'cls.predictions.transform.LayerNorm.bias', 'cls.predictions.transform.dense.bias', 'cls.predictions.decoder.weight', 'cls.predictions.bias', 'cls.predictions.transform.LayerNorm.weight', 'cls.predictions.transform.dense.weight']\n- This IS expected if you are initializing BertModel from the checkpoint of a model trained on another task or with another architecture (e.g. initializing a BertForSequenceClassification model from a BertForPreTraining model).\n- This IS NOT expected if you are initializing BertModel from the checkpoint of a model that you expect to be exactly identical (initializing a BertForSequenceClassification model from a BertForSequenceClassification model).\n\n textEmbedLayerAggregation: layers = 11 12 aggregate_layers = concatenate aggregate_tokens = mean tokens_select = tokens_deselect = single_wordembeddings = Information about the embeddings. textEmbedLayersOutput: model: bert-base-uncased layers: 11 12 . textEmbedLayerAggregation: layers = 11 12 aggregate_layers = concatenate aggregate_tokens = mean tokens_select = tokens_deselect = x = hilstotal y = swlstotal pca = aggregation = mean split = quartile word_weight_power = 1 min_freq_words_test = 0 Npermutations = 1e+06 n_per_split = 1e+05 INFORMATION ABOUT THE PLOT word_data = DP_projections_HILS_SWLS_100 k_n_words_to_test = FALSE min_freq_words_test = 1 min_freq_words_plot = 1 plot_n_words_square = 3 plot_n_words_p = 3 plot_n_word_extreme = 1 plot_n_word_frequency = 1 plot_n_words_middle = 1 y_axes = FALSE p_alpha = 0.05 overlapping TRUE p_adjust_method = bonferroni projection_metric = dot_product bivariate_color_codes = #398CF9 #60A1F7 #5dc688 #e07f6a #EAEAEA #40DD52 #FF0000 #EA7467 #85DB8E word_size_range = 3 - 8 position_jitter_hight = 0 position_jitter_width = 0.03 point_size = 0.5 arrow_transparency = 0.5 points_without_words_size = 0.2 points_without_words_alpha = 0.2 legend_x_position = 0.02 legend_y_position = 0.02 legend_h_size = 0.2 legend_w_size = 0.2 legend_title_size = 7 legend_number_size = 2 legend_number_colour = white"
#>
#> $processed_word_data
#> # A tibble: 583 × 24
#> words x_plotted p_values_x n_g1.x n_g2.x dot.y p_values_dot.y n_g1.y
#> <chr> <dbl> <dbl> <dbl> <dbl> <dbl> <dbl> <dbl>
#> 1 able 1.42 0.194 0 1 2.99 0.0000181 0
#> 2 accept… 0.732 0.451 -1 1 1.40 0.0396 -1
#> 3 accord 2.04 0.0651 0 1 3.45 0.00000401 0
#> 4 active 1.46 0.180 0 1 1.92 0.00895 0
#> 5 adapta… 2.40 0.0311 0 0 0.960 0.113 0
#> 6 admiri… 0.161 0.839 0 0 1.58 0.0255 0
#> 7 adrift -2.64 0.0245 -1 0 -3.17 0.0000422 -1
#> 8 affini… 1.03 0.320 0 1 2.24 0.00324 0
#> 9 agreei… 1.62 0.140 0 1 2.12 0.00500 0
#> 10 alcohol -2.15 0.0822 -1 0 -1.78 0.0212 0
#> # ℹ 573 more rows
#> # ℹ 16 more variables: n_g2.y <dbl>, n <dbl>, n.percent <dbl>,
#> # N_participant_responses <int>, adjusted_p_values.x <dbl>,
#> # square_categories <dbl>, check_p_square <dbl>, check_p_x_neg <dbl>,
#> # check_p_x_pos <dbl>, check_extreme_max_x <dbl>,
#> # check_extreme_min_x <dbl>, check_extreme_frequency_x <dbl>,
#> # check_middle_x <dbl>, check_random_x <dbl>, extremes_all_x <dbl>, …
#>
names(DP_projections_HILS_SWLS_100)
#> [1] "word_data"
#>
#> $description
#> [1] "INFORMATION ABOUT THE PROJECTION type = textProjection words = $ wordembeddings = Information about the embeddings. textEmbedLayersOutput: model: bert-base-uncased ; layers: 11 12 . Warnings from python: Some weights of the model checkpoint at bert-base-uncased were not used when initializing BertModel: ['cls.seq_relationship.bias', 'cls.seq_relationship.weight', 'cls.predictions.transform.LayerNorm.bias', 'cls.predictions.transform.dense.bias', 'cls.predictions.decoder.weight', 'cls.predictions.bias', 'cls.predictions.transform.LayerNorm.weight', 'cls.predictions.transform.dense.weight']\n- This IS expected if you are initializing BertModel from the checkpoint of a model trained on another task or with another architecture (e.g. initializing a BertForSequenceClassification model from a BertForPreTraining model).\n- This IS NOT expected if you are initializing BertModel from the checkpoint of a model that you expect to be exactly identical (initializing a BertForSequenceClassification model from a BertForSequenceClassification model).\n\n textEmbedLayerAggregation: layers = 11 12 aggregate_layers = concatenate aggregate_tokens = mean tokens_select = tokens_deselect = single_wordembeddings = Information about the embeddings. textEmbedLayersOutput: model: bert-base-uncased layers: 11 12 . textEmbedLayerAggregation: layers = 11 12 aggregate_layers = concatenate aggregate_tokens = mean tokens_select = tokens_deselect = x = $ y = $ pca = aggregation = mean split = quartile word_weight_power = 1 min_freq_words_test = 0 Npermutations = 1e+06 n_per_split = 1e+05 type = textProjection words = Language_based_assessment_data_3_100 wordembeddings = Information about the embeddings. textEmbedLayersOutput: model: bert-base-uncased ; layers: 11 12 . Warnings from python: Some weights of the model checkpoint at bert-base-uncased were not used when initializing BertModel: ['cls.seq_relationship.bias', 'cls.seq_relationship.weight', 'cls.predictions.transform.LayerNorm.bias', 'cls.predictions.transform.dense.bias', 'cls.predictions.decoder.weight', 'cls.predictions.bias', 'cls.predictions.transform.LayerNorm.weight', 'cls.predictions.transform.dense.weight']\n- This IS expected if you are initializing BertModel from the checkpoint of a model trained on another task or with another architecture (e.g. initializing a BertForSequenceClassification model from a BertForPreTraining model).\n- This IS NOT expected if you are initializing BertModel from the checkpoint of a model that you expect to be exactly identical (initializing a BertForSequenceClassification model from a BertForSequenceClassification model).\n\n textEmbedLayerAggregation: layers = 11 12 aggregate_layers = concatenate aggregate_tokens = mean tokens_select = tokens_deselect = single_wordembeddings = Information about the embeddings. textEmbedLayersOutput: model: bert-base-uncased layers: 11 12 . textEmbedLayerAggregation: layers = 11 12 aggregate_layers = concatenate aggregate_tokens = mean tokens_select = tokens_deselect = x = Language_based_assessment_data_3_100 y = Language_based_assessment_data_3_100 pca = aggregation = mean split = quartile word_weight_power = 1 min_freq_words_test = 0 Npermutations = 1e+06 n_per_split = 1e+05 type = textProjection words = harmonywords wordembeddings = Information about the embeddings. textEmbedLayersOutput: model: bert-base-uncased ; layers: 11 12 . Warnings from python: Some weights of the model checkpoint at bert-base-uncased were not used when initializing BertModel: ['cls.seq_relationship.bias', 'cls.seq_relationship.weight', 'cls.predictions.transform.LayerNorm.bias', 'cls.predictions.transform.dense.bias', 'cls.predictions.decoder.weight', 'cls.predictions.bias', 'cls.predictions.transform.LayerNorm.weight', 'cls.predictions.transform.dense.weight']\n- This IS expected if you are initializing BertModel from the checkpoint of a model trained on another task or with another architecture (e.g. initializing a BertForSequenceClassification model from a BertForPreTraining model).\n- This IS NOT expected if you are initializing BertModel from the checkpoint of a model that you expect to be exactly identical (initializing a BertForSequenceClassification model from a BertForSequenceClassification model).\n\n textEmbedLayerAggregation: layers = 11 12 aggregate_layers = concatenate aggregate_tokens = mean tokens_select = tokens_deselect = single_wordembeddings = Information about the embeddings. textEmbedLayersOutput: model: bert-base-uncased layers: 11 12 . textEmbedLayerAggregation: layers = 11 12 aggregate_layers = concatenate aggregate_tokens = mean tokens_select = tokens_deselect = x = hilstotal y = swlstotal pca = aggregation = mean split = quartile word_weight_power = 1 min_freq_words_test = 0 Npermutations = 1e+06 n_per_split = 1e+05 INFORMATION ABOUT THE PLOT word_data = DP_projections_HILS_SWLS_100 k_n_words_to_test = FALSE min_freq_words_test = 1 min_freq_words_plot = 1 plot_n_words_square = 3 plot_n_words_p = 3 plot_n_word_extreme = 1 plot_n_word_frequency = 1 plot_n_words_middle = 1 y_axes = FALSE p_alpha = 0.05 overlapping TRUE p_adjust_method = bonferroni projection_metric = dot_product bivariate_color_codes = #398CF9 #60A1F7 #5dc688 #e07f6a #EAEAEA #40DD52 #FF0000 #EA7467 #85DB8E word_size_range = 3 - 8 position_jitter_hight = 0 position_jitter_width = 0.03 point_size = 0.5 arrow_transparency = 0.5 points_without_words_size = 0.2 points_without_words_alpha = 0.2 legend_x_position = 0.02 legend_y_position = 0.02 legend_h_size = 0.2 legend_w_size = 0.2 legend_title_size = 7 legend_number_size = 2 legend_number_colour = white"
#>
#> $processed_word_data
#> # A tibble: 583 × 24
#> words x_plotted p_values_x n_g1.x n_g2.x dot.y p_values_dot.y n_g1.y
#> <chr> <dbl> <dbl> <dbl> <dbl> <dbl> <dbl> <dbl>
#> 1 able 1.42 0.194 0 1 2.99 0.0000181 0
#> 2 accept… 0.732 0.451 -1 1 1.40 0.0396 -1
#> 3 accord 2.04 0.0651 0 1 3.45 0.00000401 0
#> 4 active 1.46 0.180 0 1 1.92 0.00895 0
#> 5 adapta… 2.40 0.0311 0 0 0.960 0.113 0
#> 6 admiri… 0.161 0.839 0 0 1.58 0.0255 0
#> 7 adrift -2.64 0.0245 -1 0 -3.17 0.0000422 -1
#> 8 affini… 1.03 0.320 0 1 2.24 0.00324 0
#> 9 agreei… 1.62 0.140 0 1 2.12 0.00500 0
#> 10 alcohol -2.15 0.0822 -1 0 -1.78 0.0212 0
#> # ℹ 573 more rows
#> # ℹ 16 more variables: n_g2.y <dbl>, n <dbl>, n.percent <dbl>,
#> # N_participant_responses <int>, adjusted_p_values.x <dbl>,
#> # square_categories <dbl>, check_p_square <dbl>, check_p_x_neg <dbl>,
#> # check_p_x_pos <dbl>, check_extreme_max_x <dbl>,
#> # check_extreme_min_x <dbl>, check_extreme_frequency_x <dbl>,
#> # check_middle_x <dbl>, check_random_x <dbl>, extremes_all_x <dbl>, …
#>
names(DP_projections_HILS_SWLS_100)
#> [1] "word_data"