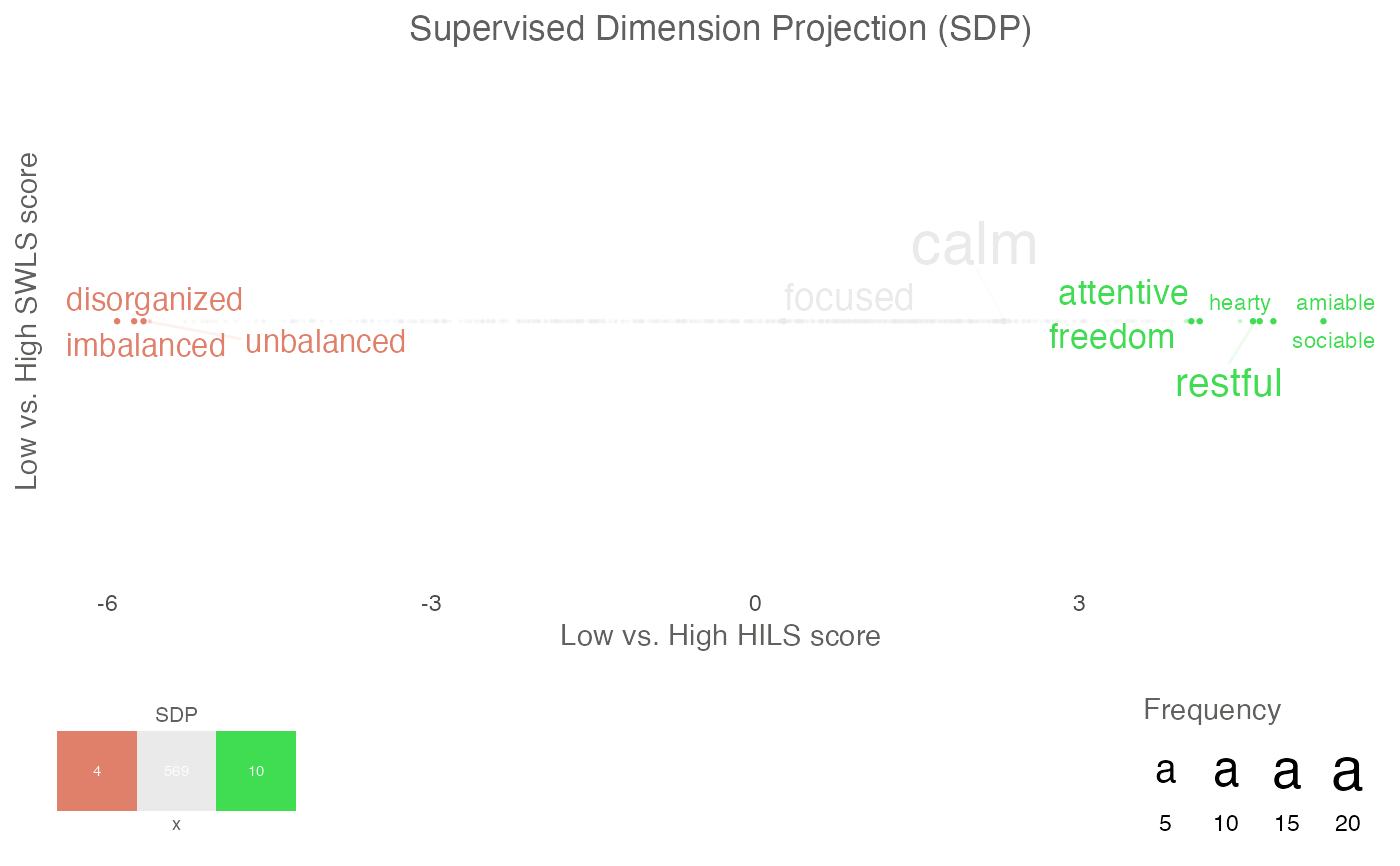
textProjectionPlot() plots words according to Supervised Dimension Projection.
Usage
textProjectionPlot(
  word_data,
  k_n_words_to_test = FALSE,
  min_freq_words_test = 1,
  min_freq_words_plot = 1,
  plot_n_words_square = 3,
  plot_n_words_p = 5,
  plot_n_word_extreme = 5,
  plot_n_word_frequency = 5,
  plot_n_words_middle = 5,
  plot_n_word_random = 0,
  titles_color = "#61605e",
  y_axes = FALSE,
  p_alpha = 0.05,
  overlapping = TRUE,
  p_adjust_method = "none",
  projection_metric = "dot_product",
  title_top = "Supervised Dimension Projection",
  x_axes_label = "Supervised Dimension Projection (SDP)",
  y_axes_label = "Supervised Dimension Projection (SDP)",
  scale_x_axes_lim = NULL,
  scale_y_axes_lim = NULL,
  word_font = NULL,
  bivariate_color_codes = c("#398CF9", "#60A1F7", "#5dc688", "#e07f6a", "#EAEAEA",
    "#40DD52", "#FF0000", "#EA7467", "#85DB8E"),
  word_size_range = c(3, 8),
  position_jitter_hight = 0,
  position_jitter_width = 0.03,
  point_size = 0.5,
  arrow_transparency = 0.1,
  points_without_words_size = 0.2,
  points_without_words_alpha = 0.2,
  legend_title = "SDP",
  legend_x_axes_label = "x",
  legend_y_axes_label = "y",
  legend_x_position = 0.02,
  legend_y_position = 0.02,
  legend_h_size = 0.2,
  legend_w_size = 0.2,
  legend_title_size = 7,
  legend_number_size = 2,
  legend_number_colour = "white",
  group_embeddings1 = FALSE,
  group_embeddings2 = FALSE,
  projection_embedding = FALSE,
  aggregated_point_size = 0.8,
  aggregated_shape = 8,
  aggregated_color_G1 = "black",
  aggregated_color_G2 = "black",
  projection_color = "blue",
  seed = 1005,
  explore_words = NULL,
  explore_words_color = "#ad42f5",
  explore_words_point = "ALL_1",
  explore_words_aggregation = "mean",
  remove_words = NULL,
  n_contrast_group_color = NULL,
  n_contrast_group_remove = FALSE,
  space = NULL,
  scaling = FALSE
)
Arguments
- word_data
Dataframe from textProjection
- k_n_words_to_test
Select the k most frequent words to significance test (k = sqrt(100*N); N = number of participant responses). Default = TRUE.
- min_freq_words_test
Select words to significance test that have occurred at least min_freq_words_test (default = 1).
- min_freq_words_plot
Select words to plot that has occurred at least min_freq_words_plot times.
- plot_n_words_square
Select number of significant words in each square of the figure to plot. The significant words, in each square is selected according to most frequent words.
- plot_n_words_p
Number of significant words to plot on each(positive and negative) side of the x-axes and y-axes, (where duplicates are removed); selects first according to lowest p-value and then according to frequency. Hence, on a two dimensional plot it is possible that plot_n_words_p = 1 yield 4 words.
- plot_n_word_extreme
Number of words that are extreme on Supervised Dimension Projection per dimension. (i.e., even if not significant; per dimensions, where duplicates are removed).
- plot_n_word_frequency
Number of words based on being most frequent. (i.e., even if not significant).
- plot_n_words_middle
Number of words plotted that are in the middle in Supervised Dimension Projection score (i.e., even if not significant; per dimensions, where duplicates are removed).
- plot_n_word_random
(numeric) select random words to plot.
- titles_color
Color for all the titles (default: "#61605e")
- y_axes
If TRUE, also plotting on the y-axes (default is FALSE). Also plotting on y-axes produces a two dimension 2-dimensional plot, but the textProjection function has to have had a variable on the y-axes.
- p_alpha
Alpha (default = .05).
- overlapping
(boolean) Allow overlapping (TRUE) or disallow (FALSE) (default = TRUE).
- p_adjust_method
Method to adjust/correct p-values for multiple comparisons (default = "holm"; see also "none", "hochberg", "hommel", "bonferroni", "BH", "BY", "fdr").
- projection_metric
(character) Metric to plot according to; "dot_product" or "cohens_d".
- title_top
Title (default " ")
- x_axes_label
Label on the x-axes.
- y_axes_label
Label on the y-axes.
- scale_x_axes_lim
Manually set the length of the x-axes (default = NULL, which uses ggplot2::scale_x_continuous(limits = scale_x_axes_lim); change e.g., by trying c(-5, 5)).
- scale_y_axes_lim
Manually set the length of the y-axes (default = NULL; which uses ggplot2::scale_y_continuous(limits = scale_y_axes_lim); change e.g., by trying c(-5, 5)).
- word_font
Font type (default: NULL).
- bivariate_color_codes
The different colors of the words. Note that, at the moment, two squares should not have the exact same colour-code because the numbers within the squares of the legend will then be aggregated (and show the same, incorrect value). (default: c("#398CF9", "#60A1F7", "#5dc688", "#e07f6a", "#EAEAEA", "#40DD52", "#FF0000", "#EA7467", "#85DB8E")).
- word_size_range
Vector with minimum and maximum font size (default: c(3, 8)).
- position_jitter_hight
Jitter height (default: .0).
- position_jitter_width
Jitter width (default: .03).
- point_size
Size of the points indicating the words' position (default: 0.5).
- arrow_transparency
Transparency of the lines between each word and point (default: 0.1).
- points_without_words_size
Size of the points not linked with a words (default is to not show it, i.e., 0).
- points_without_words_alpha
Transparency of the points not linked with a words (default is to not show it, i.e., 0).
- legend_title
Title on the color legend (default: "(SDP)".
- legend_x_axes_label
Label on the color legend (default: "(x)".
- legend_y_axes_label
Label on the color legend (default: "(y)".
- legend_x_position
Position on the x coordinates of the color legend (default: 0.02).
- legend_y_position
Position on the y coordinates of the color legend (default: 0.05).
- legend_h_size
Height of the color legend (default 0.15).
- legend_w_size
Width of the color legend (default 0.15).
- legend_title_size
Font size (default: 7).
- legend_number_size
Font size of the values in the legend (default: 2).
- legend_number_colour
(string) Colour of the numbers in the box legend.
- group_embeddings1
Shows a point representing the aggregated word embedding for group 1 (default = FALSE).
- group_embeddings2
Shows a point representing the aggregated word embedding for group 2 (default = FALSE).
- projection_embedding
Shows a point representing the aggregated direction embedding (default = FALSE).
- aggregated_point_size
Size of the points representing the group_embeddings1, group_embeddings2 and projection_embedding
- aggregated_shape
Shape type of the points representing the group_embeddings1, group_embeddings2 and projection_embeddingd
- aggregated_color_G1
Color
- aggregated_color_G2
Color
- projection_color
Color
- seed
Set different seed.
- explore_words
Explore where specific words are positioned in the embedding space. For example, c("happy content", "sad down").
- explore_words_color
Specify the color(s) of the words being explored. For example c("#ad42f5", "green")
- explore_words_point
Specify the names of the point for the aggregated word embeddings of all the explored words.
- explore_words_aggregation
Specify how to aggregate the word embeddings of the explored words.
- remove_words
manually remove words from the plot (which is done just before the words are plotted so that the remove_words are part of previous counts/analyses).
- n_contrast_group_color
Set color to words that have higher frequency (N) on the other opposite side of its dot product projection (default = NULL).
- n_contrast_group_remove
Remove words that have higher frequency (N) on the other opposite side of its dot product projection (default = FALSE).
- space
Provide a semantic space if using static embeddings and wanting to explore words.
- scaling
Scaling word embeddings before aggregation.
See also
See textProjection.
Examples
# The test-data included in the package is called: DP_projections_HILS_SWLS_100.
# The dataframe created by textProjection can also be used as input-data.

# Supervised Dimension Projection Plot
plot_projection <- textProjectionPlot(
  word_data = DP_projections_HILS_SWLS_100,
  k_n_words_to_test = FALSE,
  min_freq_words_test = 1,
  plot_n_words_square = 3,
  plot_n_words_p = 3,
  plot_n_word_extreme = 1,
  plot_n_word_frequency = 1,
  plot_n_words_middle = 1,
  y_axes = FALSE,
  p_alpha = 0.05,
  title_top = "Supervised Dimension Projection (SDP)",
  x_axes_label = "Low vs. High HILS score",
  y_axes_label = "Low vs. High SWLS score",
  p_adjust_method = "bonferroni",
  scale_y_axes_lim = NULL
)

plot_projection
#> $final_plot

#>
#> $description
#> [1] "INFORMATION ABOUT THE PROJECTION type = textProjection words = $ wordembeddings = Information about the embeddings. textEmbedLayersOutput:  model: bert-base-uncased ;  layers: 11 12 . Warnings from python:  Some weights of the model checkpoint at bert-base-uncased were not used when initializing BertModel: ['cls.seq_relationship.bias', 'cls.seq_relationship.weight', 'cls.predictions.transform.LayerNorm.bias', 'cls.predictions.transform.dense.bias', 'cls.predictions.decoder.weight', 'cls.predictions.bias', 'cls.predictions.transform.LayerNorm.weight', 'cls.predictions.transform.dense.weight']\n- This IS expected if you are initializing BertModel from the checkpoint of a model trained on another task or with another architecture (e.g. initializing a BertForSequenceClassification model from a BertForPreTraining model).\n- This IS NOT expected if you are initializing BertModel from the checkpoint of a model that you expect to be exactly identical (initializing a BertForSequenceClassification model from a BertForSequenceClassification model).\n\n textEmbedLayerAggregation: layers =  11 12 aggregate_layers =  concatenate aggregate_tokens =  mean tokens_select =   tokens_deselect =   single_wordembeddings = Information about the embeddings. textEmbedLayersOutput:  model: bert-base-uncased layers: 11 12 . textEmbedLayerAggregation: layers =  11 12 aggregate_layers =  concatenate aggregate_tokens =  mean tokens_select =   tokens_deselect =   x = $ y = $ pca =  aggregation =  mean split =  quartile word_weight_power = 1 min_freq_words_test = 0 Npermutations = 1e+06 n_per_split = 1e+05 type = textProjection words = Language_based_assessment_data_3_100 wordembeddings = Information about the embeddings. textEmbedLayersOutput:  model: bert-base-uncased ;  layers: 11 12 . Warnings from python:  Some weights of the model checkpoint at bert-base-uncased were not used when initializing BertModel: ['cls.seq_relationship.bias', 'cls.seq_relationship.weight', 'cls.predictions.transform.LayerNorm.bias', 'cls.predictions.transform.dense.bias', 'cls.predictions.decoder.weight', 'cls.predictions.bias', 'cls.predictions.transform.LayerNorm.weight', 'cls.predictions.transform.dense.weight']\n- This IS expected if you are initializing BertModel from the checkpoint of a model trained on another task or with another architecture (e.g. initializing a BertForSequenceClassification model from a BertForPreTraining model).\n- This IS NOT expected if you are initializing BertModel from the checkpoint of a model that you expect to be exactly identical (initializing a BertForSequenceClassification model from a BertForSequenceClassification model).\n\n textEmbedLayerAggregation: layers =  11 12 aggregate_layers =  concatenate aggregate_tokens =  mean tokens_select =   tokens_deselect =   single_wordembeddings = Information about the embeddings. textEmbedLayersOutput:  model: bert-base-uncased layers: 11 12 . textEmbedLayerAggregation: layers =  11 12 aggregate_layers =  concatenate aggregate_tokens =  mean tokens_select =   tokens_deselect =   x = Language_based_assessment_data_3_100 y = Language_based_assessment_data_3_100 pca =  aggregation =  mean split =  quartile word_weight_power = 1 min_freq_words_test = 0 Npermutations = 1e+06 n_per_split = 1e+05 type = textProjection words = harmonywords wordembeddings = Information about the embeddings. textEmbedLayersOutput:  model: bert-base-uncased ;  layers: 11 12 . Warnings from python:  Some weights of the model checkpoint at bert-base-uncased were not used when initializing BertModel: ['cls.seq_relationship.bias', 'cls.seq_relationship.weight', 'cls.predictions.transform.LayerNorm.bias', 'cls.predictions.transform.dense.bias', 'cls.predictions.decoder.weight', 'cls.predictions.bias', 'cls.predictions.transform.LayerNorm.weight', 'cls.predictions.transform.dense.weight']\n- This IS expected if you are initializing BertModel from the checkpoint of a model trained on another task or with another architecture (e.g. initializing a BertForSequenceClassification model from a BertForPreTraining model).\n- This IS NOT expected if you are initializing BertModel from the checkpoint of a model that you expect to be exactly identical (initializing a BertForSequenceClassification model from a BertForSequenceClassification model).\n\n textEmbedLayerAggregation: layers =  11 12 aggregate_layers =  concatenate aggregate_tokens =  mean tokens_select =   tokens_deselect =   single_wordembeddings = Information about the embeddings. textEmbedLayersOutput:  model: bert-base-uncased layers: 11 12 . textEmbedLayerAggregation: layers =  11 12 aggregate_layers =  concatenate aggregate_tokens =  mean tokens_select =   tokens_deselect =   x = hilstotal y = swlstotal pca =  aggregation =  mean split =  quartile word_weight_power = 1 min_freq_words_test = 0 Npermutations = 1e+06 n_per_split = 1e+05 INFORMATION ABOUT THE PLOT word_data = word_data k_n_words_to_test = FALSE min_freq_words_test = 1 min_freq_words_plot = 1 plot_n_words_square = 3 plot_n_words_p = 3 plot_n_word_extreme = 1 plot_n_word_frequency = 1 plot_n_words_middle = 1 y_axes = FALSE p_alpha = 0.05 overlapping TRUE p_adjust_method =  bonferroni projection_metric =  dot_product bivariate_color_codes = #398CF9 #60A1F7 #5dc688 #e07f6a #EAEAEA #40DD52 #FF0000 #EA7467 #85DB8E word_size_range = 3 - 8 position_jitter_hight = 0 position_jitter_width = 0.03 point_size = 0.5 arrow_transparency = 0.5 points_without_words_size = 0.2 points_without_words_alpha = 0.2 legend_x_position = 0.02 legend_y_position = 0.02 legend_h_size = 0.2 legend_w_size = 0.2 legend_title_size = 7 legend_number_size = 2 legend_number_colour = white"
#>
#> $processed_word_data
#> # A tibble: 583 × 24
#>    words   x_plotted p_values_x n_g1.x n_g2.x  dot.y p_values_dot.y n_g1.y
#>    <chr>       <dbl>      <dbl>  <dbl>  <dbl>  <dbl>          <dbl>  <dbl>
#>  1 able        1.42      0.194       0      1  2.99      0.0000181       0
#>  2 accept…     0.732     0.451      -1      1  1.40      0.0396         -1
#>  3 accord      2.04      0.0651      0      1  3.45      0.00000401      0
#>  4 active      1.46      0.180       0      1  1.92      0.00895         0
#>  5 adapta…     2.40      0.0311      0      0  0.960     0.113           0
#>  6 admiri…     0.161     0.839       0      0  1.58      0.0255          0
#>  7 adrift     -2.64      0.0245     -1      0 -3.17      0.0000422      -1
#>  8 affini…     1.03      0.320       0      1  2.24      0.00324         0
#>  9 agreei…     1.62      0.140       0      1  2.12      0.00500         0
#> 10 alcohol    -2.15      0.0822     -1      0 -1.78      0.0212          0
#> # ℹ 573 more rows
#> # ℹ 16 more variables: n_g2.y <dbl>, n <dbl>, n.percent <dbl>,
#> #   N_participant_responses <int>, adjusted_p_values.x <dbl>,
#> #   square_categories <dbl>, check_p_square <dbl>, check_p_x_neg <dbl>,
#> #   check_p_x_pos <dbl>, check_extreme_max_x <dbl>,
#> #   check_extreme_min_x <dbl>, check_extreme_frequency_x <dbl>,
#> #   check_middle_x <dbl>, check_random_x <dbl>, extremes_all_x <dbl>, …
#>

# Investigate elements in DP_projections_HILS_SWLS_100.
names(DP_projections_HILS_SWLS_100)
#> [1] "word_data"
#>
#> $description
#> [1] "INFORMATION ABOUT THE PROJECTION type = textProjection words = $ wordembeddings = Information about the embeddings. textEmbedLayersOutput: model: bert-base-uncased ; layers: 11 12 . Warnings from python: Some weights of the model checkpoint at bert-base-uncased were not used when initializing BertModel: ['cls.seq_relationship.bias', 'cls.seq_relationship.weight', 'cls.predictions.transform.LayerNorm.bias', 'cls.predictions.transform.dense.bias', 'cls.predictions.decoder.weight', 'cls.predictions.bias', 'cls.predictions.transform.LayerNorm.weight', 'cls.predictions.transform.dense.weight']\n- This IS expected if you are initializing BertModel from the checkpoint of a model trained on another task or with another architecture (e.g. initializing a BertForSequenceClassification model from a BertForPreTraining model).\n- This IS NOT expected if you are initializing BertModel from the checkpoint of a model that you expect to be exactly identical (initializing a BertForSequenceClassification model from a BertForSequenceClassification model).\n\n textEmbedLayerAggregation: layers = 11 12 aggregate_layers = concatenate aggregate_tokens = mean tokens_select = tokens_deselect = single_wordembeddings = Information about the embeddings. textEmbedLayersOutput: model: bert-base-uncased layers: 11 12 . textEmbedLayerAggregation: layers = 11 12 aggregate_layers = concatenate aggregate_tokens = mean tokens_select = tokens_deselect = x = $ y = $ pca = aggregation = mean split = quartile word_weight_power = 1 min_freq_words_test = 0 Npermutations = 1e+06 n_per_split = 1e+05 type = textProjection words = Language_based_assessment_data_3_100 wordembeddings = Information about the embeddings. textEmbedLayersOutput: model: bert-base-uncased ; layers: 11 12 . Warnings from python: Some weights of the model checkpoint at bert-base-uncased were not used when initializing BertModel: ['cls.seq_relationship.bias', 'cls.seq_relationship.weight', 'cls.predictions.transform.LayerNorm.bias', 'cls.predictions.transform.dense.bias', 'cls.predictions.decoder.weight', 'cls.predictions.bias', 'cls.predictions.transform.LayerNorm.weight', 'cls.predictions.transform.dense.weight']\n- This IS expected if you are initializing BertModel from the checkpoint of a model trained on another task or with another architecture (e.g. initializing a BertForSequenceClassification model from a BertForPreTraining model).\n- This IS NOT expected if you are initializing BertModel from the checkpoint of a model that you expect to be exactly identical (initializing a BertForSequenceClassification model from a BertForSequenceClassification model).\n\n textEmbedLayerAggregation: layers = 11 12 aggregate_layers = concatenate aggregate_tokens = mean tokens_select = tokens_deselect = single_wordembeddings = Information about the embeddings. textEmbedLayersOutput: model: bert-base-uncased layers: 11 12 . textEmbedLayerAggregation: layers = 11 12 aggregate_layers = concatenate aggregate_tokens = mean tokens_select = tokens_deselect = x = Language_based_assessment_data_3_100 y = Language_based_assessment_data_3_100 pca = aggregation = mean split = quartile word_weight_power = 1 min_freq_words_test = 0 Npermutations = 1e+06 n_per_split = 1e+05 type = textProjection words = harmonywords wordembeddings = Information about the embeddings. textEmbedLayersOutput: model: bert-base-uncased ; layers: 11 12 . Warnings from python: Some weights of the model checkpoint at bert-base-uncased were not used when initializing BertModel: ['cls.seq_relationship.bias', 'cls.seq_relationship.weight', 'cls.predictions.transform.LayerNorm.bias', 'cls.predictions.transform.dense.bias', 'cls.predictions.decoder.weight', 'cls.predictions.bias', 'cls.predictions.transform.LayerNorm.weight', 'cls.predictions.transform.dense.weight']\n- This IS expected if you are initializing BertModel from the checkpoint of a model trained on another task or with another architecture (e.g. initializing a BertForSequenceClassification model from a BertForPreTraining model).\n- This IS NOT expected if you are initializing BertModel from the checkpoint of a model that you expect to be exactly identical (initializing a BertForSequenceClassification model from a BertForSequenceClassification model).\n\n textEmbedLayerAggregation: layers = 11 12 aggregate_layers = concatenate aggregate_tokens = mean tokens_select = tokens_deselect = single_wordembeddings = Information about the embeddings. textEmbedLayersOutput: model: bert-base-uncased layers: 11 12 . textEmbedLayerAggregation: layers = 11 12 aggregate_layers = concatenate aggregate_tokens = mean tokens_select = tokens_deselect = x = hilstotal y = swlstotal pca = aggregation = mean split = quartile word_weight_power = 1 min_freq_words_test = 0 Npermutations = 1e+06 n_per_split = 1e+05 INFORMATION ABOUT THE PLOT word_data = word_data k_n_words_to_test = FALSE min_freq_words_test = 1 min_freq_words_plot = 1 plot_n_words_square = 3 plot_n_words_p = 3 plot_n_word_extreme = 1 plot_n_word_frequency = 1 plot_n_words_middle = 1 y_axes = FALSE p_alpha = 0.05 overlapping TRUE p_adjust_method = bonferroni projection_metric = dot_product bivariate_color_codes = #398CF9 #60A1F7 #5dc688 #e07f6a #EAEAEA #40DD52 #FF0000 #EA7467 #85DB8E word_size_range = 3 - 8 position_jitter_hight = 0 position_jitter_width = 0.03 point_size = 0.5 arrow_transparency = 0.5 points_without_words_size = 0.2 points_without_words_alpha = 0.2 legend_x_position = 0.02 legend_y_position = 0.02 legend_h_size = 0.2 legend_w_size = 0.2 legend_title_size = 7 legend_number_size = 2 legend_number_colour = white"
#>
#> $processed_word_data
#> # A tibble: 583 × 24
#> words x_plotted p_values_x n_g1.x n_g2.x dot.y p_values_dot.y n_g1.y
#> <chr> <dbl> <dbl> <dbl> <dbl> <dbl> <dbl> <dbl>
#> 1 able 1.42 0.194 0 1 2.99 0.0000181 0
#> 2 accept… 0.732 0.451 -1 1 1.40 0.0396 -1
#> 3 accord 2.04 0.0651 0 1 3.45 0.00000401 0
#> 4 active 1.46 0.180 0 1 1.92 0.00895 0
#> 5 adapta… 2.40 0.0311 0 0 0.960 0.113 0
#> 6 admiri… 0.161 0.839 0 0 1.58 0.0255 0
#> 7 adrift -2.64 0.0245 -1 0 -3.17 0.0000422 -1
#> 8 affini… 1.03 0.320 0 1 2.24 0.00324 0
#> 9 agreei… 1.62 0.140 0 1 2.12 0.00500 0
#> 10 alcohol -2.15 0.0822 -1 0 -1.78 0.0212 0
#> # ℹ 573 more rows
#> # ℹ 16 more variables: n_g2.y <dbl>, n <dbl>, n.percent <dbl>,
#> # N_participant_responses <int>, adjusted_p_values.x <dbl>,
#> # square_categories <dbl>, check_p_square <dbl>, check_p_x_neg <dbl>,
#> # check_p_x_pos <dbl>, check_extreme_max_x <dbl>,
#> # check_extreme_min_x <dbl>, check_extreme_frequency_x <dbl>,
#> # check_middle_x <dbl>, check_random_x <dbl>, extremes_all_x <dbl>, …
#>
# Investigate elements in DP_projections_HILS_SWLS_100.
names(DP_projections_HILS_SWLS_100)
#> [1] "word_data"